/ Discover the best web application monitoring tools you need for your business
Tested, reviewed & compared by industry experts
Every day thousands of websites slow down to a crawl, sites go completely offline or suffer seemingly random issues. These problems can cost site owners tens of thousands of dollars in lost conversions, sales and perhaps worse: damage to their brand. We assessed the top tools in the industry to help your business gain a reliable monitoring solution.
Compare Monitoring Categories
Every day thousands of websites slow down to a crawl, sites go completely offline or suffer seemingly random issues. These problems can cost site owners tens of thousands of dollars in lost conversions, sales and perhaps worse: damage to their brand. We assessed the top tools in the industry to help your business gain a reliable monitoring solution.
Featured Top Tools for Monitoring
Our experts have tested the top tools on the market. Check out our detailed analysis for the best recommendations for the web application monitoring your business needs.
Web App Monitoring
This site will help you identify the best application monitoring tools to find and troubleshoot performance issues and rapidly resolve problems.
We’ve curated four of the top web application monitoring tools to help you determine the best way to solve your particular problems and to monitor your environments for future issues.
We understand that there are many more solutions out there and new tools arrive on the market every day, but the tools we focus on here will give you a solid foundation in understanding your options for an application monitoring toolset.

In today’s digital environment, web application performance monitoring is not optional for serious businesses and organizations. Application monitoring needs to be front and center of practically every discussion around the development and maintenance of web applications – whereas before it may have been left to an afterthought, digital leaders need to foreground the importance of application and performance monitoring. Why? With the right monitoring software, you’ll be able to:
- Track web application availability / uptime
- Measure web application performance
- Improve web application functionality
- Streamline management, diagnostics, troubleshooting, and mean time to repair (MTTR)
- Enhance network infrastructure – address bottlenecks, effectively scale, better plan capacity upgrades
- Rely on accurate error and performance alerts, which is to say you’ll know exactly what is causing a given problem as it happens
| Tool | Key Features | Summary | Our Review | Expert Rating |
|---|---|---|---|---|
| Dotcom-Monitor | * real user and browser testing * point and click scripting | Industry leading website monitoring tool with point and click scripting and more. | [review] | |
| UptimeRobot | * free and paid plans * 50 basic (five minute) uptime checks are free | A rudimentary but helpful tool for basic website monitoring. | [review] | |
| Pingdom | * synthetic and real user monitoring * APM integration | A relatively easy-to-use platform for website performance monitoring. | [review] | |
| Statuscake | * basic and enterprise type plans * designed with teams in mind | A website performance monitoring platform with a basic (free) tier and support for enterprise. | [review] | |
| Uptime.com | * customized monitoring dashboards | Website performance monitoring backed by top-rated support. | [review] |
- Dotcom-Monitor
Dotcom-Monitor offers a comprehensive performance monitoring experience with its UserView software–this software tracks user actions and helps you create test scripts. Real-browser testing means accurate results.
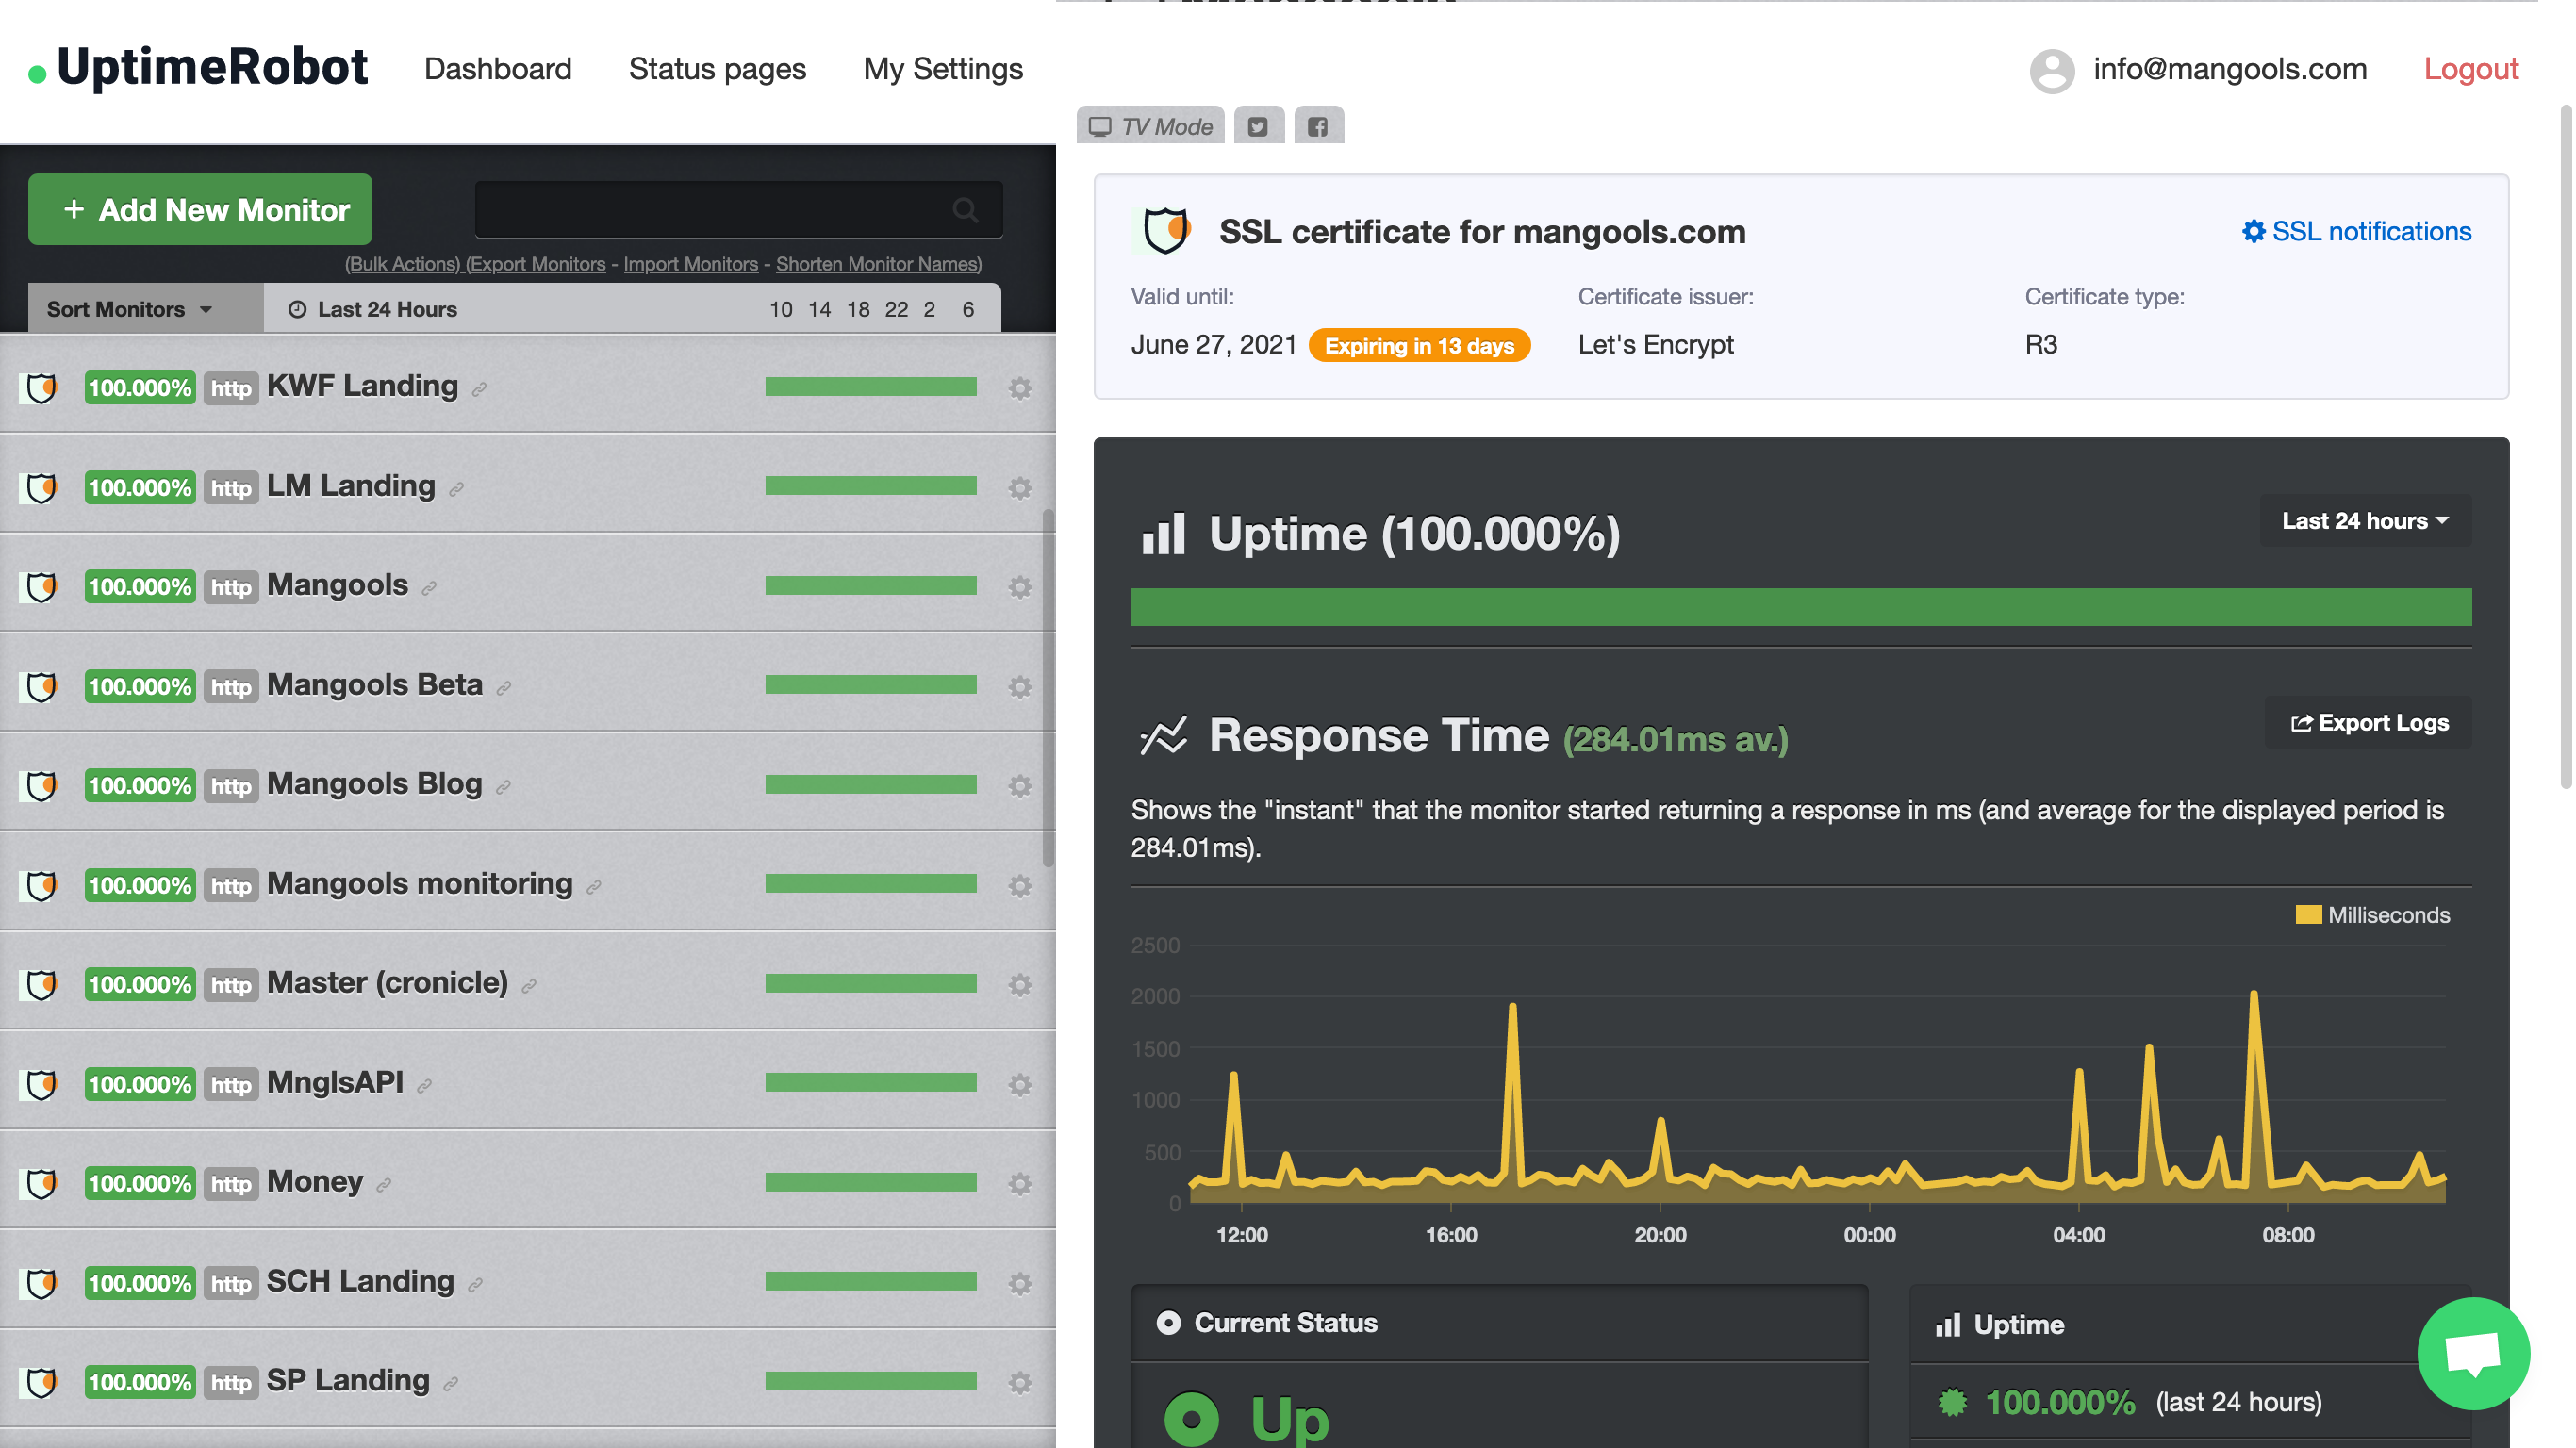
Offering scalability with free and paid plans, UptimeRobot can be helpful for new and growing businesses with basic performance management requirements in need of a low barrier to entry. Get 50 (basic) monitors with 5-minute checks free.
Pingdom from SolarWinds boasts 100+ servers to allow for synthetic monitoring, Pingdom offers a fairly comprehensive performance monitoring service. It’s comparatively easy to use for the non-technical user and includes a 30 day trial, and offers both synthetic and real user monitoring.
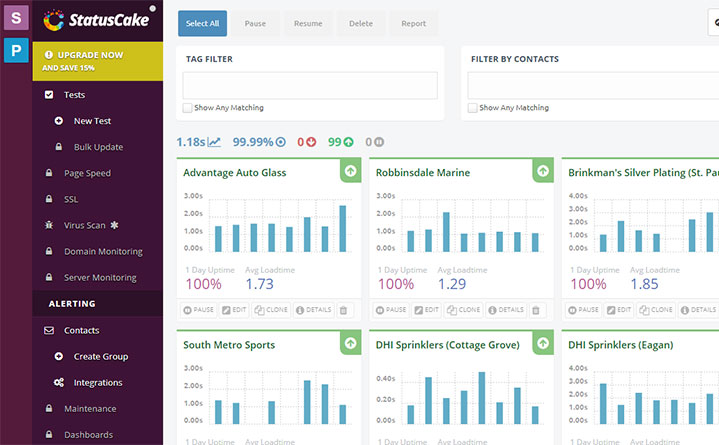
With the ability to pinpoint errors, Statuscake can help you help make your website error-free and fast. Many popular brands such as gaming giant EA use it, although its basic plans are comparatively rudimentary and it’s not as targeted toward enterprise users right out of the box.
Uptime.com, offering under a variety of subscription plans, also has a 21 day trial so you can test the waters and experience their customized monitoring dashboards. Uptime.com also offers advanced, custom, and enterprise plans.

- Dotcom-Monitor
Dotcom-Monitor offers the most powerful and realistic testing experience in the market. A cloud-based website monitoring tool, Dotcom-Monitor is unique in that it allows you to use real-browsers to perform monitoring. This means the results as true to life as possible. Trusted by major household brands like Comcast and Dell, Dotcom-Monitor is the standout performance monitoring tool in the space. With a robust, free trial, you can start to benefit from Dotcom-Monitor today at no cost.
UptimeRobot is a rudimentary but useful web-based monitoring tool that you can deploy to ensure your website is up and running at all times. It will update alert you of any downtime as soon as possible with text and email alerts sent to your devices. You can easily share results with peers to allow for collaboration and assistance and also solve server related downtime issues, with some learning curve. The big deal? Get 50 monitors with 5-minute checks free.
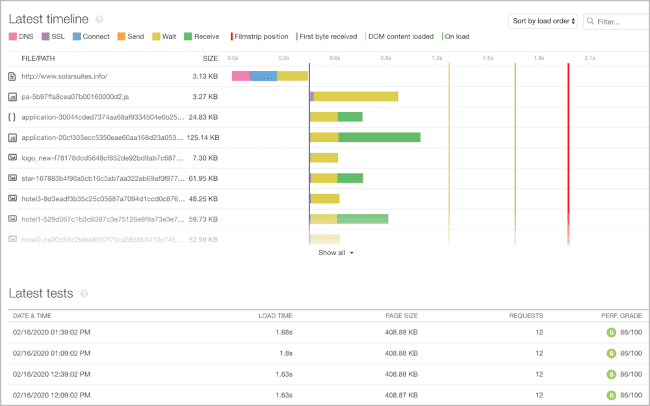
An easy to implement tool, Pingdom from SolarWinds helps you analyze downtime issues and keep your website in top condition through both synthetic and real user monitoring. Pingdom offers data visualization tools that help translate complicated metrics into readable ones. Pingdom features a helpful interface for non-technical users and will of course serve to alert you when your website goes down, and offers both synthetic and real user monitoring plans at a low barrier to entry.
Statuscake will, like every other performance monitoring platform, immediately inform you when your website experiences downtime. It’s also equipped to deliver insights that let you know possible causes for downtime and performance issues. Regional monitoring from multiple locations is also possible. It offers a basic free tier that allows you to kick the tires, although to do much beyond basic monitoring, you’ll need to upgrade and will probably require an expensive custom solution.
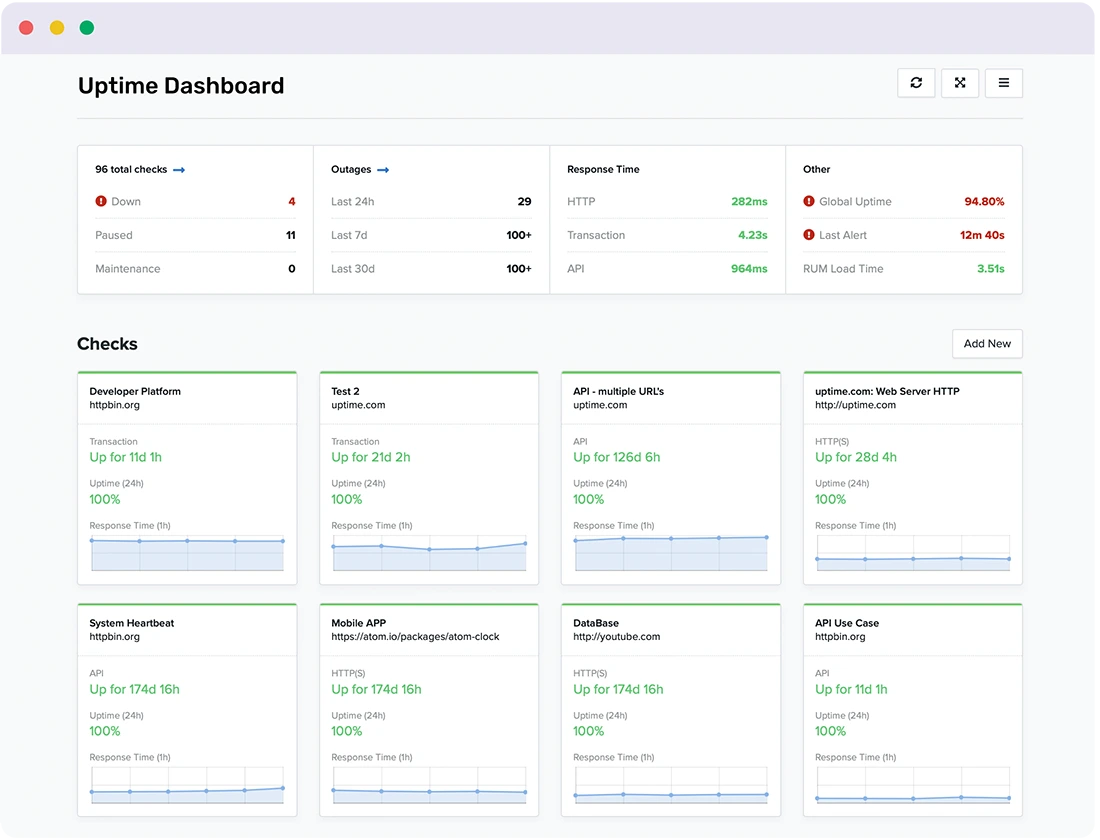
With Uptime.com, you’ll be able to access thorough reports to allow for performance analysis. It has an easy to use interface–you don’t have to be a developer or technical user to know how to use it. Configuration is also relatively simple, which means you won’t have to invest much time and effort training your employees how to use the tool. Clients include IBM, Reuters, and WordPress.
Web Application Performance Monitoring: Trends for 2023
| Tool | Key Features | Summary | Our Review | Expert Rating |
|---|---|---|---|---|
| Dotcom-Monitor | * real user and browser testing * point and click scripting | Industry leading application monitoring tool with real user monitoring, point and click scripting and more. | [review] | |
| Uptrends | * includes integrations with Slack, Teams and more * basic paid plans start with ten monitors | Real user monitoring with a free trial, no credit card required. | [review] | |
| Site24x7 | * real user monitoring * AWS and Azure monitoring | Performance monitoring solutions for DevOps and IT operations. | [review] | |
| ManageEngine | * synthetic and real user monitoring * Features a Google Play & Apple app | Visibility into the performance and user experience of applications and infrastructure. | [review] | |
| Datadog | * real user and synthetic monitoring * Basic free plan with one day data retention | End-to-end traces, metrics, and logs make your applications, entirely observable. | [review] |
- Dotcom-Monitor
Dotcom-Monitor offers a comprehensive performance monitoring experience with its UserView software–this software tracks user actions and helps you create test scripts. Real-browser testing means accurate results.
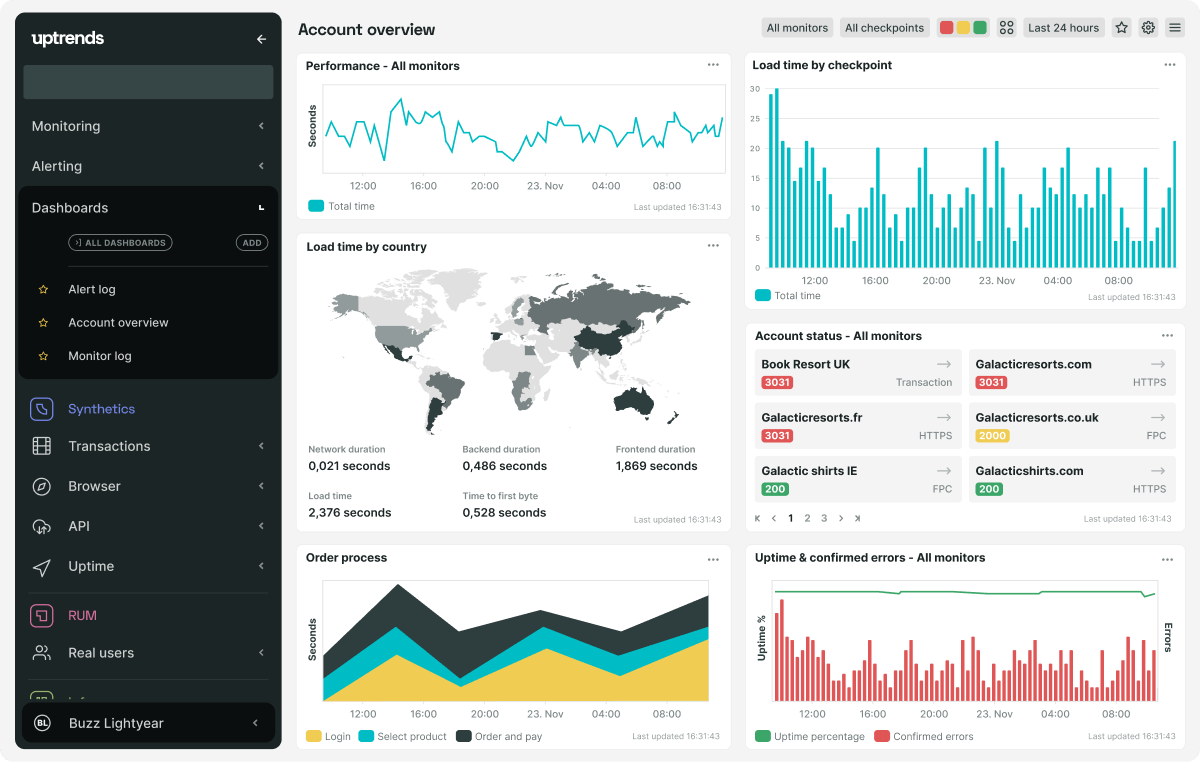
With Uptrends, you’ll have a log of user interactions to help you understand where issues might lie so your development team can optimize your web applications.
Site24x7 is, as the name states, always available. This isn’t unique to the space, of course. It can also deliver you a number of performance metrics for your development team to analyze for weaknesses.
This platforms helps you manage errors, whether at the network or system level, and helps you keep your web application up to date. It will also help to measure the physical health of your servers. It supports Java, .NET, .NET core, Node.js, PHP and Ruby applications.
Datadog integrates with multiple platforms, helping you manage your entire technology stack with a focus on infrastructure.
- Dotcom-Monitor
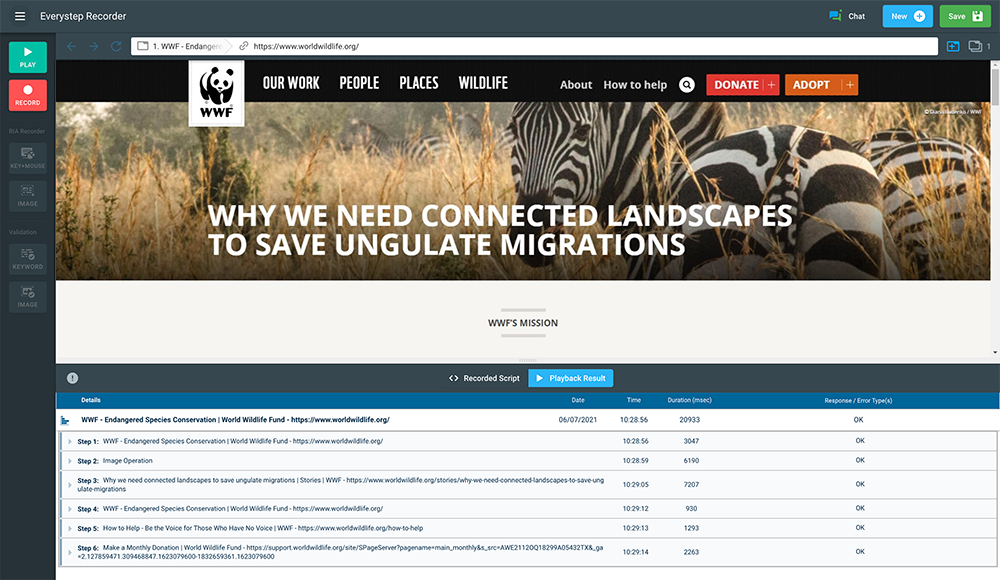
You never need to worry about creating complicated test scripts, since Dotcom-Monitor’s EveryStep Recorder allows you to see the interactions your users have with your web application. Dotcom-Monitor allows you to easily simulate the precise user behavior you want to focus on. With real-browser testing, you’ll receive the most true to life results available in the performance monitoring space. Leveraging Dotcom-Monitor’s cloud-based software, you can monitor your web application globally backed by industry-leading support. With a feature-rich, free trial, you can begin to use Dotcom-Monitor today at no cost.
Uptrends allows you to take action every time your application runs into a problem, allowing a smooth recovery process. This also allows for less downtime and more time given to customers who want the website up and running. Uptrends offers the ability to monitor from a wide variety of locations, and provides a highly customizable process for monitoring. The software will also capture the screen whenever you run into a problem, making it which makes to find the root cause of a breakdown. Uptrends presently monitors using the latest version of Chrome from 231 locations worldwide.
Site24x7 solves many application monitoring needs. It’s easy to install and includes a thorough knowledge base you can use to learn about use cases and monitoring best practices. It’s easy to maneuver and can help you develop an action plan to solve the issues your web application may be facing through its intuitive notification system. It supports various App Servers including Tomcat Monitoring, WebSphere Monitoring, WebLogic Monitoring, GlassFish Monitoring, and IIS Monitoring.
ManageEngine Applications Manager offers a customer support system in addition to ease-of-access in terms of setting up. Despite its simplicity, it’s robust enough for a decent sized business. Any server and any application can easily be monitored with customizable actions with this software. You can witness the strength and capabilities of your servers using its performance analysis tool. It can also give a transactional analysis for the actions that go through on your web application, and supports Java, .NET, .NET core, Node.js, PHP and Ruby applications.
Datadog integrates different software, making it possible for it to function simultaneously with other monitoring tools. This integration makes it possible for you to import and export data to and from Datadog. You’re able to see issues on the client’s side fairly quickly with this software. Its usability is remarkable. The range of observability possible with this software is also unique, making it suitable for you if you have a large number of applications you want to manage.
How Does Web Application Monitoring Work?
Web application monitor relies on a a synthetic monitor or bot. This bot can be set to take periodic actions on a website or application, using a browser just like a real user in order to assess performance and uptime. In effect anything a user can do on your application in a browser, this web application monitor can do at a given interval. If and when the monitor bot discovers an error or performance degradation, you and/or your team receive an alert.
With more sophisticated web application monitoring tools, you can get granular control over what triggers an alert in terms of performance and/or downtime and who should receive an alert, when, and by which means. Beyond this, a robust web monitoring tool will give you and your engineering team an incredible amount of information in order to make the right decisions about your application’s continued development and maintenance.
Active Support & Comprehensive Knowledge-Bases
Credibility of the Provider by Way of Reviews & Social Proof
Global Monitoring Capacity, Including Behind “the Great Firewall”
Application Monitoring Tools That Track Exceptions
Log and Data Output Performance Tracking with User-friendly Reports
Application Performance Monitoring
The shift in application monitoring tools to focus on APM to meet the needs of developers continues. While this was important in years past, it’s mission critical in 2023. Web application performance monitoring must no longer be an afterthought but has to be backed into every phase of the development and management process of a given application.
| Tool | Key Features | Summary | Our Review | Expert Rating |
|---|---|---|---|---|
| AppDynamics | * full-stack correlation * demo and free trial available | Correlate full stack performance with key metrics like conversions and rapidly resolve the most important issues. | [review] | |
| Dynatrace | * emphasis on security * demo and free trial available | Simplify the cloud to innovate faster with observability, AIOps, and application security in one platform. | [review] | |
| Dotcom-Monitor | * Easy-to-use platform for all kinds of users * demo and free trial available | Industry leading application performance management tool with real user monitoring, point and click scripting and more. | [review] | |
| Datadog | * real user and synthetic monitoring * Basic free plan with one day data retention | Visibility into the performance and user experience of applications and infrastructure. | [review] | |
| New Relic | * tailored to engineers * code-level visibility | An all-in-one platform for data-driven engineers. | [review] |
App Dynamics from Cisco is a nine-time Gartner MQ leader that provides unrivaled clarity for complex application environments, getting business-critical information to the right person at the right time in context. For APM, they are the stand-out and offer a free trial.
Pitched as “delivering best-in-class observability through an open, AI-powered data platform,” Dynatrace provides a wide range of performance monitoring tools. Dynatrace is able to give a big picture analysis of all your applications and their functions. It also works to help you solve software issues–all in one place.
With Dotcom-Monitor, you can easily analyze highly complex transactions through real-browser testing and a powerful scripting tool. Many features, including the ability to monitor log-in pages, checkout pages and more are available. Dotcom-Monitor also offers a feature-rich free trial and industry-leading support.
Datadog gives you the opportunity to look at your web applications from a bird’s eye view, with a special focus on data at scale (hence the name). Datadog also allows you to trace and track where software improvements can be made, with “end-to-end distributed tracing and service-centric observability at scale, correlated to all telemetry.”
With simple analytics and deep visibility into your application infrastructure, New Relic gives you a concise framework with which to monitor your applications’ performance. You’re able to troubleshoot as well as fix any bugs. “New Relic is where dev, ops, security and business teams solve software–performance problems with data.”

- App Dynamics
App Dynamics tops the charts with its easy to use and easy to install software. It provides detailed information about the functioning of your applications. The use of it also makes analysis pretty easy. App Dynamics is efficient, gives detailed monitoring possibilities, and the way it’s been built makes it a superb tool for web application performance management. From their website: “A Gartner MQ leader in 2021 for the 9th time. AppDynamics APM provides unmatched clarity for complex application environments.”
With Dynatrace, you’ll have all your web application related solutions in one place. You can test both, at the macro level, and also micro level. This enables you to test and monitor transactions as well as infrastructure. Dynatrace is easy to use and can possibly provide you with a one-stop shop. Organizations that have multiple applications working in their system can benefit from the functionality of Dynatrace. With a free trial and low barrier to entry, Dynatrace can solve most APM requirements.
Providing the most comprehensive set of tools you need to monitor your web applications, Dotcom-Monitor can be used for all platforms and can also be customized for unique business transactions and stacks. With Dotcom-Monitor, you’re able to monitor on real web browsers, making the experience more realistic, and you can literally follow a user’s actions through the web application, point at it, and click to emulate it to test for performance of your web application. Dotcom-Monitor also offers load testing for your website, making it a truly comprehensive platform with exceptional support and documentation. With a generous free trial, you can see how powerful Dotcom-Monitor is today at no cost.
Datadog offers monitoring and security services that allow you to see inside your apps and development stacks at scale, anywhere. With a turn-key integration, log data in context with automated tagging and correlation, and aggregate metrics, Datadog can be a helpful tool for more advanced users in need of comprehensive performance monitoring at scale. Datadog offers end-to-end distributed tracing and service-centric observability at scale, correlated to all telemetry and so earns its name with a heavy focus on data at scale.
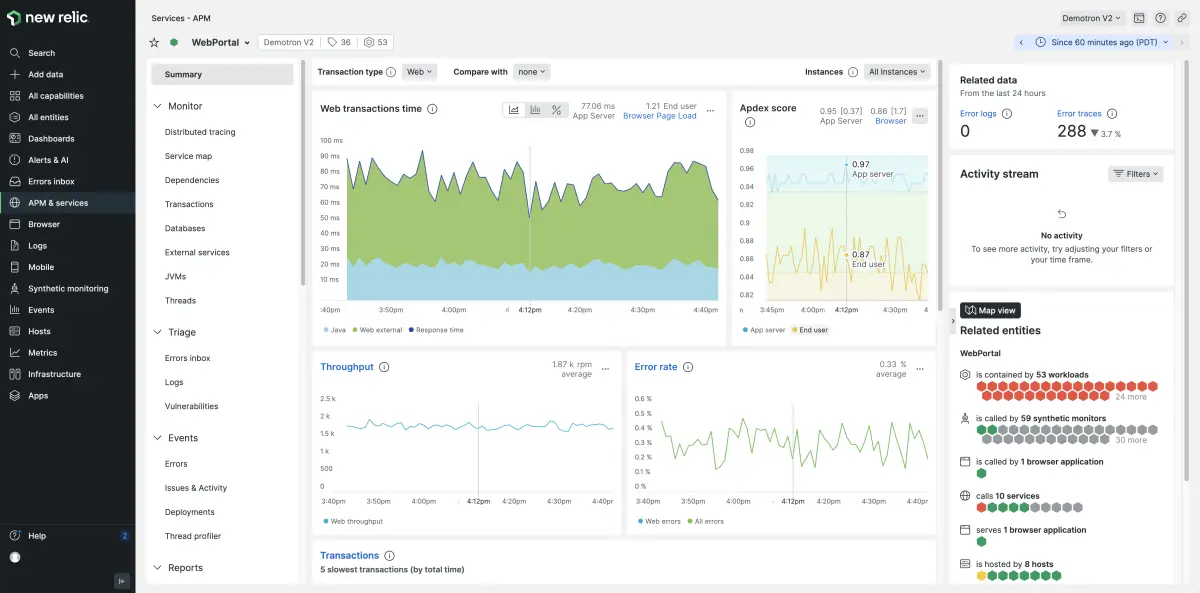
A unified platform is important for any application performance monitoring tool, and New Relic provides just that with a monitoring service for apps and microservices. New Relic will monitor everything from the hundreds of dependencies of a modern stack down to simple web-transaction times and app throughput. By seeing transaction times and stacks, you can analyze and improve the productivity of any application. You’re also able to monitor the health of your systems by seeing how much of each component is being used for a specific function. New Relic also allows you to create your own scenarios to see how well your web application will perform to your requirements.
Web Application Monitoring Blog

Web Application Health Monitoring: Tips & Tricks
Learn all about web application health monitoring with tips and tricks to help make your web applications stable and available at all times.

Web Application Monitoring Tools: Free vs. Paid
Learn all about web application monitoring tools and how paid tools give an edge over free ones for serious organizations looking to ensure uptime and guarantee the best user experience possible.

How to Use a Digital Signature in a Web Application
Learn all about digital signatures in web applications, why and how to use them, and how this process can be made secure.